
Subtitle: How I used v0.dev and Vercel Edge to turn a raw FPGA data stream into a cinematic UI without the "Cold Start" lag.
1. Introduction: Breaking the "Hard-Soft" Barrier
If you ask a hardware engineer to build a user interface, you usually get something that looks like Windows 95 on a bad day. Gray buttons, static text, and zero responsiveness. Conversely, if you ask a web developer to talk to a microcontroller, they panic at the mention of "Serial Protocols" or "Baud Rates."
In 2026, this barrier is gone.
By combining the low-latency power of Vercel Edge Functions with the generative UI capabilities of v0.dev, we can now build "Physical SaaS" dashboards that look like they belong in a sci-fi movie—in a fraction of the time.
This post documents how I built a real-time monitoring dashboard for my FPGA project using an AI-first stack. No heavy backend servers, no complex DevOps. Just pure, secured data flow.
2. The Architecture: Atoms to Bits
A common mistake is trying to make a browser connect directly to a hardware IP. It’s a security nightmare and browsers hate mixed content. Instead, I designed a "Pub/Sub" architecture that scales:

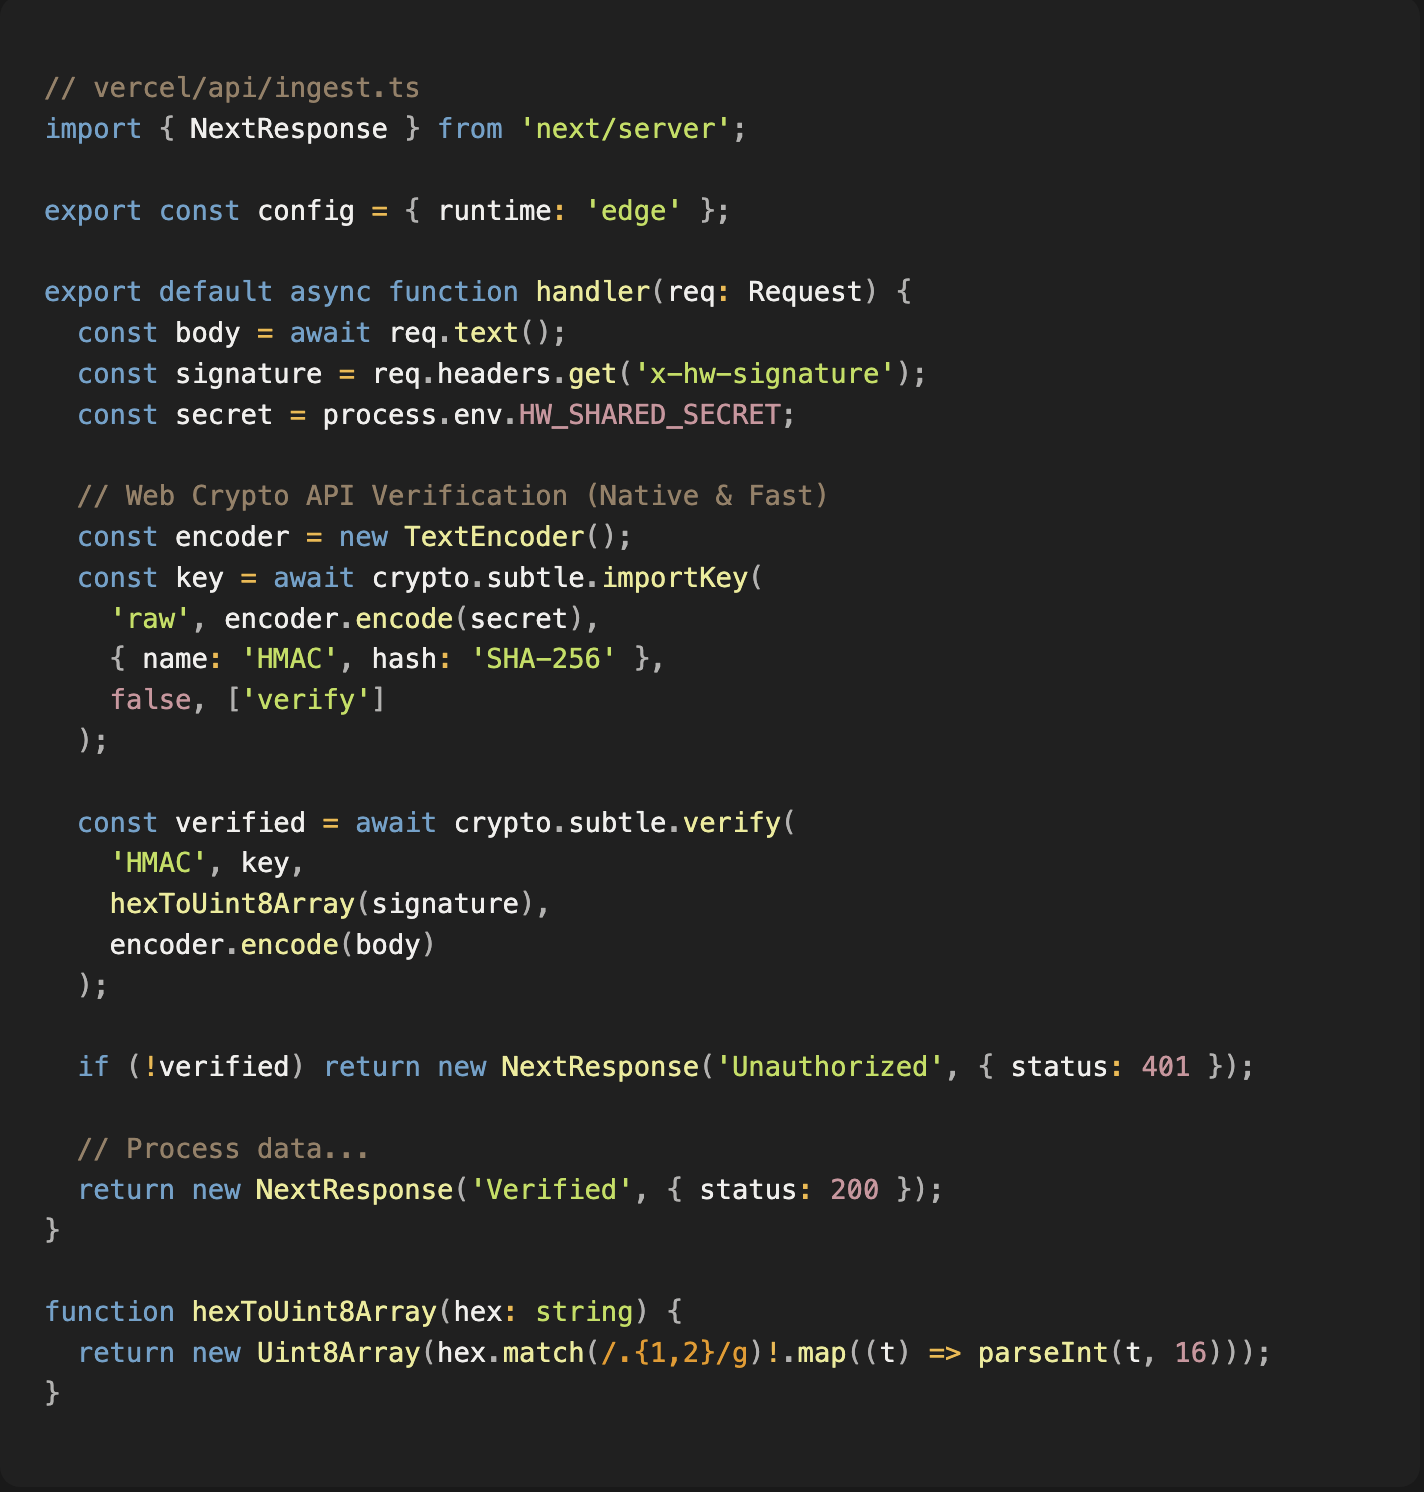
3. Hardcore Security: Edge Runtime Data Signing
In 2026, simple API keys are "low-effort" targets. To ensure my dashboard isn't fed "poisoned" data, I use HMAC-SHA256 signature verification at the Edge.
Why at the Edge?
Verifying signatures at the Vercel Edge level (using the Web Crypto API) allows us to drop unauthorized packets in <2ms, before they even touch our database or expensive compute resources.
TypeScript
4. Frontend Magic: AI Shell, Real-time Soul
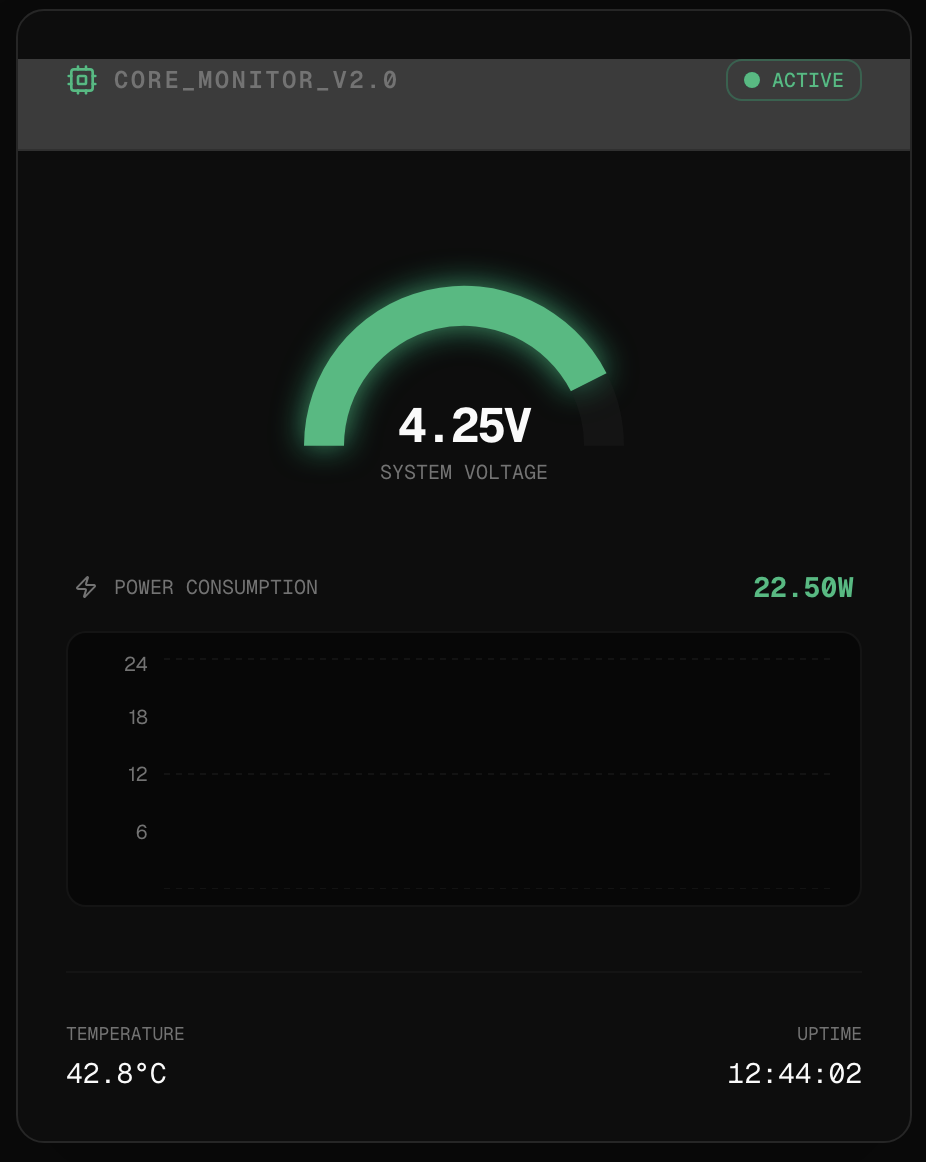
Phase A: The AI-Generated Shell
I used v0.dev to generate the "Cyber-Minimalist" look. My prompt was specific:
"Create a dark-mode dashboard card for hardware monitoring. Include a semi-circle gauge for 'Voltage' using neon blue accents and a real-time line chart using Recharts. Use Fira Code for all numerical values."
v0.dev handled the Tailwind layout and Lucide icons instantly. I just dropped the code into my components folder.
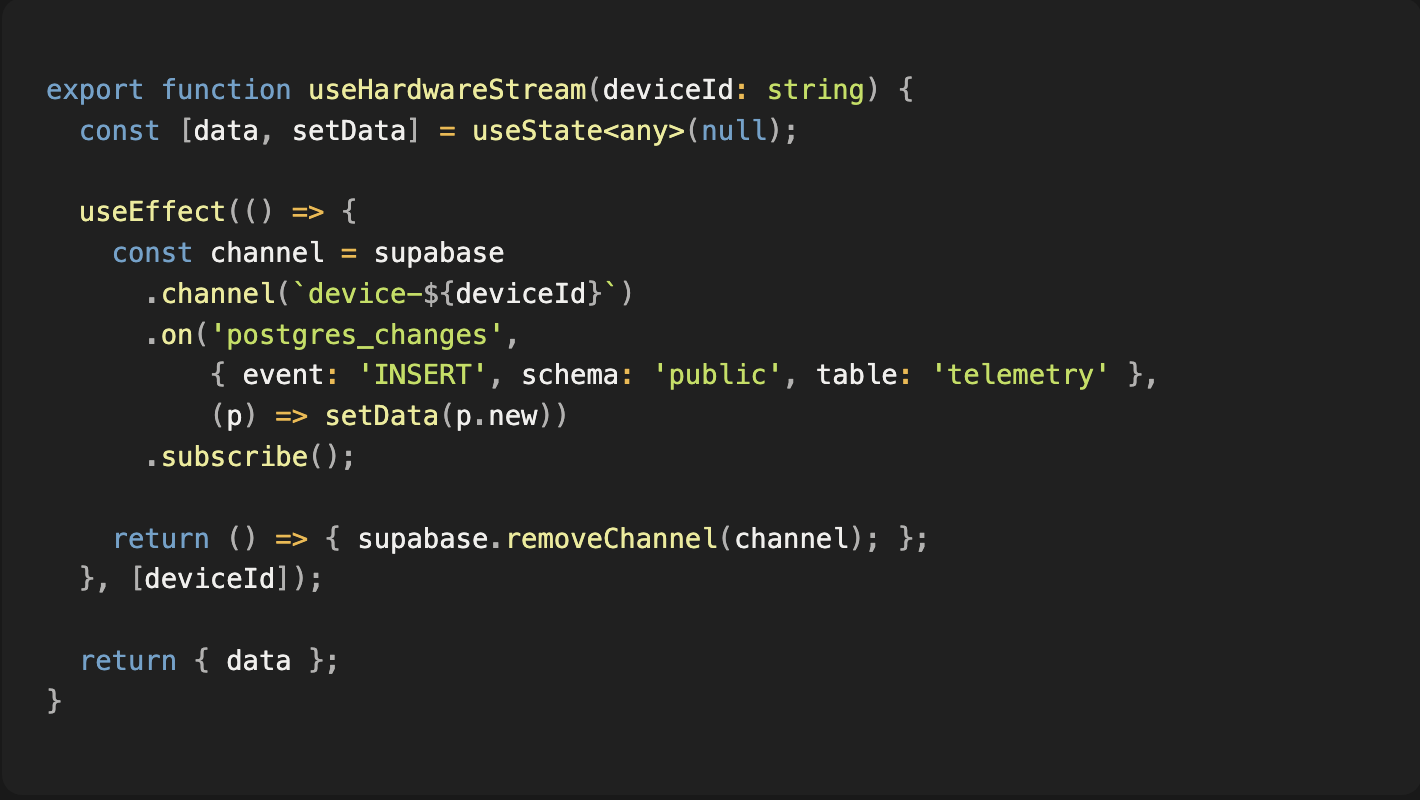
Phase B: Injecting the Real-time Soul
I used a custom hook to wire the Supabase Realtime stream into the v0 component.
TypeScript
5. The "Expert" Verdict: Lessons from the Field
After running this for several months, here is my takeaway for 2026:
- Throttling is Mandatory: Don't update your React state at 100Hz. Even the best MacBooks will stutter. I found that 10Hz is the "sweet spot" for smooth visual feedback without killing the CPU.
- Edge Aggregation: Use your Vercel Edge Function to aggregate data. If your device sends 60 packets a second, have the Edge Function calculate the average and write to the DB once every second. Your Supabase bill will thank you.
"When I first built this, my DB writes were costing me $50/week. After implementing Edge Aggregation, I dropped it to $2/week while keeping the dashboard feel just as snappy."
The final word? In 2026, the gap between "Hardware" and "Software" is just a well-written Edge Function away. Stop building ugly dashboards. Start building the future.